Replacing VS Code with Vim

OK so maybe not replacing, this is more like emulating VS Code in Vim.

Disclaimer – I like VS Code and I won’t be uninstalling it anytime soon and I’m not recommending people do.

However, I feel it can be overkill for 90% of the work that I do. So I’ve been playing around with Vim to see if it will give me what I want.

What I really want is a light weight text editor that allow me to run commands in a terminal…that’s it!

So here’s what my Vim setup looks like: –

I have a file system explorer on the left, a code editor panel to the right, and a terminal open below that. I can select code in the editor and pass it down to the terminal.

Ok, I’ll admit…configuring Vim can be daunting, especially when (like myself) you have limited experience with it. BUT it is endlessly customisable and can do pretty much anything you need.

Let’s go through my setup, starting with the file tree explorer which is NERDTree.

I’m not using any Vim plugin manager. I just cloned the NERDTree repo down, and dropped it into: –

~\vimfiles\pack\vendor\start

Then once in Vim I can run :NERDTree and voila! It opens up on the left hand side.

That’s the only plugin I currently have. There are thousands of Vim plugins but I’m trying to keep this setup as lightweight as possible so I haven’t installed any others.

Ok, time for the rest of the configuration…which is all done in my vimrc file.

First thing is to switch NERDTree to a minimal UI config: –

let NERDTreeMinimalUI=1

OK, now to configure the shell. I want to use powershell v7 as my default shell (without that annoying startup message), so I dropped this into the file: –

set shell=pwsh\ -nologo

Then I enabled syntax highlighting in the editor: –

syntax on

And I also wanted the current line to be highlighted in the editor: –

set cursorline
highlight CursorLine cterm=NONE ctermbg=0

Cool, ok now for some shortcuts. To use Ctrl+/ to switch between the editor and the terminal: –

noremap <C-/> <C-w>j
tnoremap <C-/> <C-w>k

And to use Ctrl+; to execute code from the editor in the terminal: –

noremap <C-;> Y<C-W>j<C-W>"0<C-W>k

Now to open NERDTree and a terminal on Vim startup: –

autocmd vimenter * below terminal
autocmd vimenter * NERDTree

Then I’m setting a couple of aliases for the terminal and NERDTree: –

cabbrev bterm below term
cabbrev ntree NERDTree

Finally, some generic Vim settings: –

set number
set nocompatible
set backspace=indent,eol,start
set nowrap
set nobackup
set noswapfile
set noundofile

My whole vimrc file is available here. It’s very much a work in progress as I find myself constantly tweaking it 🙂

But that’s how I’ve got Vim configured…coupled with the Windows Terminal and powershell profile settings…it’s pretty awesome!

Ok, it’ll never have all the features that VS Code does but this was fun to configure and play around with.

Thanks for reading!

Running Powershell code in Vim

I’ve been mucking about with Vim a bit recently and recently found myself (for reasons unknown tbh) writing powershell scripts in it.

Once I’d written a script, I would exit Vim to run it…however…that got me thinking, can I run powershell scripts directly in Vim?


DISCLAIMER – There’s no real reason to do this, I’d recommend using Visual Studio Code if you’re working with powershell. This is just a bit of fun 🙂


Anyway, there does seem to be a bunch of different ways to run code directly from Vim but I thought I’d share the way I’ve been doing it.

First things first, let’s install Vim. The easiest way to do so is via chocolately: –

choco install vim-tux

Once that’s installed we’re good to go! Let’s create a simple test file: –

New-Item C:\temp\test.ps1

And now open it in Vim: –

vim C:\temp\test.ps1

Let’s run something simple to try it out, add the following to test.ps1: –

$psversiontable.psversion

Ok, to run that line of powershell, hit esc and then type: –

:.w !powershell

And hit enter!

What this is doing is sending that one line to powershell which is then executing it. But what if we want to execute multiple lines of code?

To do that, we hit v to enter visual mode in Vim, then select the lines we want to execute with j, and then enter: –

: w !powershell

Vim will automatically add in ‘<,’> after the colon which indicates the selected lines.

So say we wanted to retrieve the versions of a bunch of SQL instances with this: –

Import-Module sqlserver

$Servers = Get-Content C:\temp\sqlserver.txt

foreach($Server in $Servers){
    Invoke-SqlCmd -ServerInstance $Server -Query "SELECT @@VERSION"
}

We can do that (somewhat) easily!

Kinda cool, eh?

Oh, and if you want to get rid of that annoying logo that pops up when powershell starts…add this to your vimrc file: –

cnoreabbrev powershell powershell -nologo

N.B. – The vimrc file usually lives at C:\users\USERNAME\vimfiles\vimrc, you may need to create the folder and the file itself.

Ok, not the most practical way of running powershell code but I thought it was kinda cool 🙂

Thanks for reading!

Building a pacemaker cluster to deploy a SQL Server availability group in Azure

There are new Ubuntu Pro 20.04 images available in the Azure marketplace with SQL Server 2019 pre-installed so I thought I’d run through how to create a three node pacemaker cluster with these new images in order to deploy a SQL Server availability group.

Disclaimer – The following steps will create the cluster but will not have been tested in a production environment. Any HA configuration for SQL Server needs to be thoroughly tested before going “live”.

Ok, in order to get started we will need the azure-cli installed locally in order to create our VMs for the cluster.

The steps that we are going to run through to create the cluster and deploy an availability group are: –

    1. Create VMs in Azure
    2. Install and configure pacemaker cluster
    3. Create the availability group
    4. Add colocation and promotion constraints
    5. Configure fencing resource on pacemaker cluster
    6. Test manual failover of availability group
    All the code for these steps is also available in a Github repo here

    Creating the VMs

    First thing to do is login to azure locally in a powershell window: –

    az login
    

    We can check which VM images are available: –

    az vm image list --all --offer "sql2019-ubuntupro2004"
    az vm image list --all --offer "windows-11"
    

    Set resource group name: –

    $resourceGroup = "linuxcluster"
    

    Set a username and password for access to VMs: –

    $Username = "dbafromthecold"
    $Password = "XXXXXXXXXXXXX"
    

    Create the resource group: –

    az group create --name $resourceGroup --location eastus
    

    Create availability set for the VMs: –

    az vm availability-set create `
    --resource-group $resourceGroup `
    --name $resourceGroup-as1 `
    --platform-fault-domain-count 2 `
    --platform-update-domain-count 2
    

    Create a virtual network: –

    az network vnet create `
    --resource-group $resourceGroup `
    --name $resourceGroup-vnet `
    --address-prefix 192.168.0.0/16 `
    --subnet-name $resourceGroup-vnet-sub1 `
    --subnet-prefix 192.168.0.0/24
    

    Create the VMs for the cluster using the Ubuntu Pro 20.04 image with SQL Server 2019 CU13 Developer Edition: –

    $Servers=@("ap-server-01","ap-server-02","ap-server-03")
    
    foreach($Server in $Servers){
    az vm create `
    --resource-group "$resourceGroup" `
    --name $server `
    --availability-set "$resourceGroup-as1" `
    --size "Standard_D4s_v3" `
    --image "MicrosoftSQLServer:sql2019-ubuntupro2004:sqldev_upro:15.0.211020" `
    --admin-username $Username `
    --admin-password $Password `
    --authentication-type password `
    --os-disk-size-gb 128 `
    --vnet-name "$resourceGroup-vnet" `
    --subnet "$resourceGroup-vnet-sub1" `
    --public-ip-address '""'
    }
    

    Now that we have the three VMs for the cluster, we need to create a jump box so that we can access them as the three servers do not have a public IP address (generally speaking, opening up SQL Server to the internet is a bad idea, and we’re not going to do that here)

    So create a public IP address for jump box: –

    az network public-ip create `
    --name "ap-jump-01-pip" `
    --resource-group "$resourceGroup"
    

    And then create the jump box running Windows 11: –

    az vm create `
    --resource-group "$resourceGroup" `
    --name "ap-jump-01" `
    --availability-set "$resourceGroup-as1" `
    --size "Standard_D4s_v3" `
    --image "MicrosoftWindowsDesktop:windows-11:win11-21h2-pro:22000.318.2111041236" `
    --admin-username $Username `
    --admin-password $Password `
    --os-disk-size-gb 128 `
    --vnet-name "$resourceGroup-vnet" `
    --subnet "$resourceGroup-vnet-sub1" `
    --public-ip-address "ap-jump-01-pip"
    

    Once the jump box is up, RDP to it using the public IP address and install the following: –
    Visual Studio Code
    SQL Server Management Studio
    Azure-Cli

    Install and configure pacemaker

    Now we’re almost ready to create the pacemaker cluster. But before that, we need to configure the SQL instances.

    On the jump box, ssh into each of the three servers. Once connected, enable the SQL Server Agent and enable availability groups: –

    sudo /opt/mssql/bin/mssql-conf set sqlagent.enabled true
    sudo /opt/mssql/bin/mssql-conf set hadr.hadrenabled 1
    sudo systemctl restart mssql-server
    

    Set the sa password for the SQL instances: –

    sudo systemctl stop mssql-server
    sudo /opt/mssql/bin/mssql-conf set-sa-password
    sudo systemctl start mssql-server
    

    Check status of firewall, it’s disabled by default and we’re going to leave it that way (for this lab setup): –

    sudo ufw status
    

    Add records of other servers in the cluster to /etc/hosts: –

    sudo vim /etc/hosts
    

    So for example, on ap-server-01: –

    192.168.0.4 ap-server-01
    192.168.0.5 ap-server-02
    192.168.0.6 ap-server-03
    192.168.0.10 ap-server-10
    

    N.B. – ap-sever-10 is going to be the listener name for the availability group.

    Now we can install the required packages to create the cluster: –

    sudo apt-get install -y pacemaker pacemaker-cli-utils crmsh resource-agents fence-agents csync2 python3-azure
    

    Create an authentication key on the primary server: –

    sudo corosync-keygen
    

    Copy the key generated to other servers: –

    sudo scp /etc/corosync/authkey dbafromthecold@ap-server-02:~
    sudo scp /etc/corosync/authkey dbafromthecold@ap-server-03:~
    

    Move the key from the home directory to /etc/corosync on other servers: –

    sudo mv authkey /etc/corosync/authkey
    

    OK now we can create the cluster. We do this by editing the /etc/corosync/corosync.conf file on the primary server: –

    sudo vim /etc/corosync/corosync.conf
    

    The corosync.conf file should look like this: –

    totem {
    version: 2
    cluster_name: ap-cluster-01
    transport: udpu
    crypto_cipher: none
    crypto_hash: none
    }
    
    logging {
    fileline: off
    to_stderr: yes
    to_logfile: yes
    logfile: /var/log/corosync/corosync.log
    to_syslog: yes
    debug: off
    logger_subsys {
    subsys: QUORUM
    debug: off
    }
    }
    
    quorum {
    provider: corosync_votequorum
    }
    
    nodelist {
    node {
    name: ap-server-01
    nodeid: 1
    ring0_addr: 10.0.0.4
    }
    node {
    name: ap-server-02
    nodeid: 2
    ring0_addr: 10.0.0.5
    }
    node {
    name: ap-server-03
    nodeid: 3
    ring0_addr: 10.0.0.6
    }
    }
    

    N.B. – I’ve stripped out all the comments from the file. The nodelist section is essentially where we are configuring our cluster, make sure that is correct.

    Copy the corosync.conf file to other nodes: –

    sudo scp /etc/corosync/corosync.conf dbafromthecold@ap-server-02:~
    sudo scp /etc/corosync/corosync.conf dbafromthecold@ap-server-03:~
    

    Replace the default corosync.conf file on other nodes: –

    sudo mv corosync.conf /etc/corosync/
    

    Restart pacemaker and corosync: –

    sudo systemctl restart pacemaker corosync
    

    Then confirm the status of the cluster: –

    sudo crm status
    

    Creating the availability group

    Now that the cluster has been built, we can create the availability group.

    First thing is to start the availability group extended event on each of the servers: –

    ALTER EVENT SESSION AlwaysOn_health ON SERVER WITH (STARTUP_STATE=ON);
    GO
    

    Create a certificate on primary server: –

    CREATE MASTER KEY ENCRYPTION BY PASSWORD = 'PASSWORD';
    CREATE CERTIFICATE dbm_certificate WITH SUBJECT = 'dbm';
    BACKUP CERTIFICATE dbm_certificate
    TO FILE = '/var/opt/mssql/data/dbm_certificate.cer'
    WITH PRIVATE KEY (
    FILE = '/var/opt/mssql/data/dbm_certificate.pvk',
    ENCRYPTION BY PASSWORD = 'PASSWORD'
    );
    

    Copy the certificate to other servers: –

    sudo su
    cd /var/opt/mssql/data
    scp dbm_certificate.* dbafromthecold@ap-server-02:~
    scp dbm_certificate.* dbafromthecold@ap-server-03:~
    exit
    

    Copy the cert to /var/opt/mssql/data on the other servers and grant the mssql user access: –

    sudo su
    cp /home/dbafromthecold/dbm_certificate.* /var/opt/mssql/data/
    chown mssql:mssql /var/opt/mssql/data/dbm_certificate.*
    exit
    

    Back in SQL, create the certificate on the other servers: –

    CREATE MASTER KEY ENCRYPTION BY PASSWORD = 'PASSWORD';
    CREATE CERTIFICATE dbm_certificate
    FROM FILE = '/var/opt/mssql/data/dbm_certificate.cer'
    WITH PRIVATE KEY (
    FILE = '/var/opt/mssql/data/dbm_certificate.pvk',
    DECRYPTION BY PASSWORD = 'PASSWORD'
    );
    

    Now, create the availability group endpoints on all three servers: –

    CREATE ENDPOINT [Hadr_endpoint]
    AS TCP (LISTENER_PORT = 5022)
    FOR DATABASE_MIRRORING (
    ROLE = ALL,
    AUTHENTICATION = CERTIFICATE dbm_certificate,
    ENCRYPTION = REQUIRED ALGORITHM AES
    );
    ALTER ENDPOINT [Hadr_endpoint] STATE = STARTED;
    

    Create a login for pacemaker on all three servers: –

    USE [master]
    GO
    CREATE LOGIN [pacemakerLogin] with PASSWORD= N'PASSWORD';
    ALTER SERVER ROLE [sysadmin] ADD MEMBER [pacemakerLogin];
    GO
    

    Create password file on all three servers so that pacemaker can retrieve the credentials and connect to the SQL instances: –

    echo 'pacemakerLogin' >> ~/pacemaker-passwd
    echo 'PASSWORD' >> ~/pacemaker-passwd
    sudo mv ~/pacemaker-passwd /var/opt/mssql/secrets/passwd
    sudo chown root:root /var/opt/mssql/secrets/passwd
    sudo chmod 400 /var/opt/mssql/secrets/passwd
    

    N.B. – pacemaker runs as root so that’s why we’re setting the owner of the file to root and restricting permissions

    Now we can go ahead and create the availability group with 3 nodes to provide quorum. There’s no concept of file share or disk witnesses in pacemaker so that’s why the cluster has to have an odd number of nodes. SQL Standard edition only allows for 2 nodes but you can deploys a “configuration only” SQL Express instance. This instance acts similarly to a witness instance in database mirroring. It’ll never host the availability group but has a vote in the cluster.

    But here we’re running the Developer Edition of SQL so we will go ahead and deploy the three node availability group.

    Run this on the primary server: –

    CREATE AVAILABILITY GROUP [ag1]
    WITH (CLUSTER_TYPE = EXTERNAL)
    FOR REPLICA ON
    N'ap-server-01'
    WITH (
    ENDPOINT_URL = N'tcp://ap-server-01:5022',
    AVAILABILITY_MODE = SYNCHRONOUS_COMMIT,
    FAILOVER_MODE = EXTERNAL,
    SEEDING_MODE = AUTOMATIC
    ),
    N'ap-server-02'
    WITH (
    ENDPOINT_URL = N'tcp://ap-server-02:5022',
    AVAILABILITY_MODE = SYNCHRONOUS_COMMIT,
    FAILOVER_MODE = EXTERNAL,
    SEEDING_MODE = AUTOMATIC
    ),
    N'ap-server-03'
    WITH(
    ENDPOINT_URL = N'tcp://ap-server-03:5022',
    AVAILABILITY_MODE = SYNCHRONOUS_COMMIT,
    FAILOVER_MODE = EXTERNAL,
    SEEDING_MODE = AUTOMATIC
    );
    ALTER AVAILABILITY GROUP [ag1] GRANT CREATE ANY DATABASE;
    GO
    

    Then join the secondaries to the availability group: –

    ALTER AVAILABILITY GROUP [ag1] JOIN WITH (CLUSTER_TYPE = EXTERNAL);
    ALTER AVAILABILITY GROUP [ag1] GRANT CREATE ANY DATABASE;
    

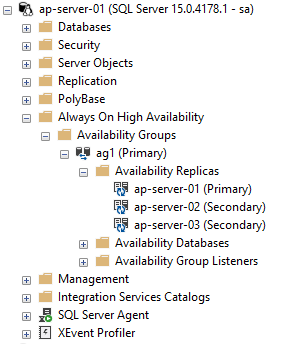
    The primary SQL instance should now look like this: –

    Grant the pacemaker login permissions to availability group: –

    GRANT ALTER, CONTROL, VIEW DEFINITION ON AVAILABILITY GROUP::ag1 TO [pacemakerLogin];
    GRANT VIEW SERVER STATE TO [pacemakerLogin];
    GO
    

    Before we create the availability group resource in pacemaker, we need to disable STONITH: –

    sudo crm configure property stonith-enabled=false
    

    N.B. – I’ll cover what this is later in the setup, ignore any warnings for this on the following commands.

    Ok, now we have the availability group in SQL we need to create the availability group resource in pacemaker.

    To do this we’re going to jump into the crm shell and create a couple of resources: –

    sudo crm
    
    configure
    
    primitive ag1_cluster \
    ocf:mssql:ag \
    params ag_name="ag1" \
    meta failure-timeout=60s \
    op start timeout=60s \
    op stop timeout=60s \
    op promote timeout=60s \
    op demote timeout=10s \
    op monitor timeout=60s interval=10s \
    op monitor timeout=60s on-fail=demote interval=11s role="Master" \
    op monitor timeout=60s interval=12s role="Slave" \
    op notify timeout=60s
    
    ms ms-ag1 ag1_cluster \
    meta master-max="1" master-node-max="1" clone-max="3" \
    clone-node-max="1" notify="true"
    
    commit
    

    The first resource created [ag1_cluster] is the availability group resource. After that, we’re creating a primary/secondary resource [ms-ag1] in pacemaker and adding the availability group resource to it. What this will do is say that the availability group resource will run on all three servers in the cluster but only one of those servers will be the primary.

    To view availability group resource: –

    sudo crm resource status ms-ag1
    

    Now we can check the status of the cluster: –

    sudo crm status
    

    N.B. – Pacemaker still uses outdated terminology to refer to the primary and secondary servers in the cluster. Hopefully this will be updated in the future.

    OK, we have our availability group created in both SQL and pacemaker. Let’s test adding database to it (running on the primary SQL instance): –

    USE [master];
    GO
    
    CREATE DATABASE [testdatabase1];
    GO
    
    BACKUP DATABASE [testdatabase1] TO DISK = N'/var/opt/mssql/data/testdatabase1.bak';
    BACKUP LOG [testdatabase1] TO DISK = N'/var/opt/mssql/data/testdatabase1.trn';
    GO
    
    ALTER AVAILABILITY GROUP [ag1] ADD DATABASE [testdatabase1];
    GO
    

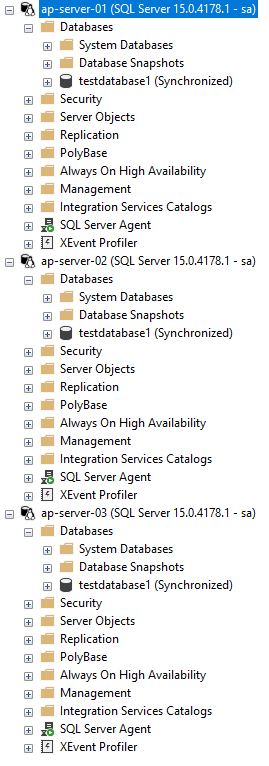
    Once that’s complete we should see the database on all three servers in the cluster: –

    Ok, next thing to do is create the listener resource in pacemaker: –

    sudo crm configure primitive virtualip \
    ocf:heartbeat:IPaddr2 \
    params ip=192.168.0.10
    

    Now go and create an internal load balancer in Azure the same way that one is created when deploying SQL Server availability groups on Windows: –
    https://docs.microsoft.com/en-us/azure/azure-sql/virtual-machines/windows/availability-group-load-balancer-portal-configure

    N.B. – the Load Balancer requirement will be removed in the future (blog is for Windows but the option for Linux is coming): –
    https://techcommunity.microsoft.com/t5/azure-sql-blog/simplify-azure-sql-virtual-machines-ha-and-dr-configuration-by/ba-p/2882897

    Now create the load balancer resource in pacemaker: –

    sudo crm configure primitive azure-load-balancer azure-lb params port=59999
    

    We’re going to be applying colocation and promotion constraints to the listener and load balancer resources in the pacemaker cluster. In order to not have to apply the constraints individually to both resources, we’re going to create a group resource and add both the listener and load balancer resources to it: –

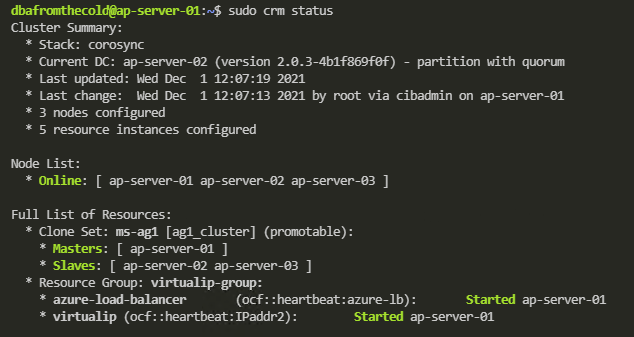
    sudo crm configure group virtualip-group azure-load-balancer virtualip
    

    Now confirm the cluster status: –

    sudo crm status
    

    And then create the listener on the primary SQL instance: –

    ALTER AVAILABILITY GROUP [ag1] ADD LISTENER N'ap-server-10' (
    WITH IP
    ((N'192.168.0.10', N'255.255.255.0')), PORT=1433);
    GO
    

    Once this is complete we can now connect to the listener in SQL Server via the IP address (an entry in the jumpbox’s hosts file will be needed to connect via the listener name)

    Adding colocation and promotion constraints to the pacemaker cluster

    In order to ensure that the listener and availability group resources always run on the same server in the cluster we are going to create a colocation constraint: –

    sudo crm configure colocation ag-with-listener INFINITY: virtualip-group ms-ag1:Master
    

    What this is doing is saying that the group containing the listener and load balancer resource will always run on the server that is the primary node in the availability group.

    OK, now we are going to create a promotion/ordering constraint: –

    sudo crm configure order ag-before-listener Mandatory: ms-ag1:promote virtualip-group:start
    

    What this is doing is saying that when a failover occurs, bring the availability group online on the new primary server and then start the listener on that server.

    To view the constraints: –

    sudo crm configure show ag-with-listener
    sudo crm configure show ag-before-listener
    

    Install and configure fencing on the cluster

    What we’re going to do now is configure fencing on the cluster. Fencing is the isolation of a failed node in a cluster which is performed by a STONITH resource. STONITH stands for, Shoot the other node in the head, a bit melodramtic maybe but, that’s exactly what it does. It’ll restart the failed node, allowing to go down, reset, come back up and rejoin the cluster, hopefully bringing the cluster into a healthy state

    Register a new application in Azure Active Directory and create a secret: –

      1. Go to Azure Active Directory in the portal and make a note of the Tenant ID.
      2. Click “App Registrations” on the left hand side menu and then click “New Registration”
      3. Enter a Name and then select “Accounts in this organization directory only”
      4. Select Application Type Web, enter http://localhost as a sign-on URL then click “Register”
      5. Click “Certificates and secrets” on the left hand side menu, then click “New client secret”
      6. Enter a description and select an expiry period
      7. Make a note of the value of the secret, it is used as the password below and the secret ID, it is used as the username below.
      8. Click “Overview” and make a note of the Application ID. It is used as the login below
      Create a json file called fence-agent-role.json and add the following (adding your subscription id): –

      {
      "Name": "Linux Fence Agent Role-ap-server-01-fence-agent",
      "Id": null,
      "IsCustom": true,
      "Description": "Allows to power-off and start virtual machines",
      "Actions": [
      "Microsoft.Compute/*/read",
      "Microsoft.Compute/virtualMachines/powerOff/action",
      "Microsoft.Compute/virtualMachines/start/action"
      ],
      "NotActions": [
      ],
      "AssignableScopes": [
      "/subscriptions/XXXXXXXX-XXXX-XXXX-XXXX-XXXXXXXXXXXX"
      ]
      }
      

      Create a custom role from the json file in a powershell session on the jumpbox: –

      az role definition create --role-definition fence-agent-role.json
      

      Now assign role and application to the VMs in the cluster: –

        1. For each of the VMs in the cluster, click “Access Control (IAM)” left hand side menu.
        2. Click Add a role assignment (use the classic experience).
        3. Select the role created above.
        4. In the Select list, enter the name of the application created earlier.
        OK, now we can create the STONITH resource using values from above and your subscription ID: –

        sudo crm configure primitive fence-vm stonith:fence_azure_arm \
        params \
        action=reboot \
        resourceGroup="linuxcluster" \
        username="XXXXXXXX-XXXX-XXXX-XXXX-XXXXXXXXXXXX" \
        login="XXXXXXXX-XXXX-XXXX-XXXX-XXXXXXXXXXXX" \
        passwd="XXXXXXXX-XXXX-XXXX-XXXX-XXXXXXXXXXXX" \
        tenantId="XXXXXXXX-XXXX-XXXX-XXXX-XXXXXXXXXXXX" \
        subscriptionId="XXXXXXXX-XXXX-XXXX-XXXX-XXXXXXXXXXXX" \
        pcmk_reboot_timeout=900 \
        power_timeout=60 \
        op monitor \
        interval=3600 \
        timeout=120
        

        And finally, set the STONITH properties: –

        sudo crm configure property cluster-recheck-interval=2min
        sudo crm configure property start-failure-is-fatal=true
        sudo crm configure property stonith-timeout=900
        sudo crm configure property concurrent-fencing=true
        sudo crm configure property stonith-enabled=true
        

        Confirm cluster status: –

        sudo crm status
        

        And there we have the fencing agent.

        Performing a manual failover

        Now we have all the resources configured on the cluster, we can test failing over the availability group. In a pacemaker cluster, we can’t failover the availability group using t-sql: –

        ALTER AVAILABILITY GROUP [ag1] FAILOVER
        

        We have to do it in pacemaker: –

        sudo crm resource move ms-ag1 ap-server-02
        

        What this will do is create a move constraint on the availability group resource, saying that it needs to be on ap-server-02. Once the availability group has moved, the group containing the listener and load balancer resources will also move (if we have our colocation and promotion constraints right).

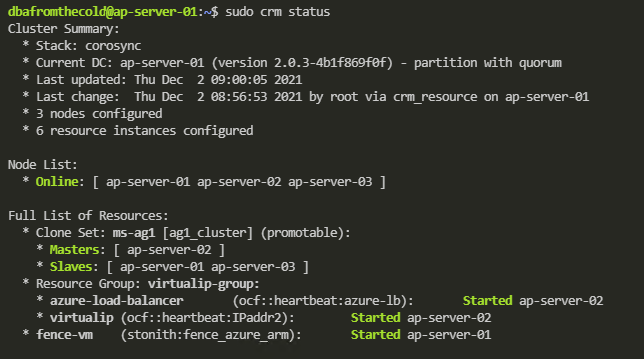
        Once the failover is complete, confirm the status of the cluster: –

        sudo crm status
        

        Now we can see that all the resources (barring the fencing resource which has moved to ap-server-01) are on the new primary! Manual failover complete!

        One final thing to do is remove that move constraint from the availability group resource.

        To view the constraint: –

        sudo crm resource constraints ms-ag1
        

        And then to delete the constraint: –

        sudo crm configure delete cli-prefer-ms-ag1
        

        And that’s it! We have successfully deployed an availability group to a pacemaker cluster in Azure and tested a manual failover.

        Thanks for reading!

        Differences between using a Load Balanced Service and an Ingress in Kubernetes

        What is the difference between using a load balanced service and an ingress to access applications in Kubernetes?

        Basically, they achieve the same thing. Being able to access an application that’s running in Kubernetes from outside of the cluster, but there are differences!

        The key difference between the two is that ingress operates at networking layer 7 (the application layer) so routes connections based on http host header or url path. Load balanced services operate at layer 4 (the transport layer) so can load balance arbitrary tcp/udp/sctp services.

        Ok, that statement doesn’t really clear things up (for me anyway). I’m a practical person by nature…so let’s run through examples of both (running everything in Kubernetes for Docker Desktop).

        What we’re going to do is spin up two nginx pages that will serve as our applications and then firstly use load balanced services to access them, followed by an ingress.

        So let’s create two nginx deployments from a custom image (available on the GHCR): –

        kubectl create deployment nginx-page1 --image=ghcr.io/dbafromthecold/nginx:page1
        kubectl create deployment nginx-page2 --image=ghcr.io/dbafromthecold/nginx:page2
        

        And expose those deployments with a load balanced service: –

        kubectl expose deployment nginx-page1 --type=LoadBalancer --port=8000 --target-port=80
        kubectl expose deployment nginx-page2 --type=LoadBalancer --port=9000 --target-port=80
        

        Confirm that the deployments and services have come up successfully: –

        kubectl get all
        

        Ok, now let’s check that the nginx pages are working. As we’ve used a load balanced service in k8s in Docker Desktop they’ll be available as localhost:PORT: –

        curl localhost:8000
        curl localhost:9000
        

        Great! So we’re using the external IP address (local host in this case) and a port number to connect to our applications.

        Now let’s have a look at using an ingress.

        First, let’s get rid of those load balanced services: –

        kubectl delete service nginx-page1 nginx-page2
        

        And create two new cluster IP services: –

        kubectl expose deployment nginx-page1 --type=ClusterIP --port=8000 --target-port=80
        kubectl expose deployment nginx-page2 --type=ClusterIP --port=9000 --target-port=80
        

        So now we have our pods running and two cluster IP services, which aren’t accessible from outside of the cluster: –

        The services have no external IP so what we need to do is deploy an ingress controller.

        An ingress controller will provide us with one external IP address, that we can map to a DNS entry. Once the controller is up and running we then use an ingress resources to define routing rules that will map external requests to different services within the cluster.

        Kubernetes currently supports GCE and nginx controllers, we’re going to use an nginx ingress controller.

        To spin up the controller run: –

        kubectl apply -f https://raw.githubusercontent.com/kubernetes/ingress-nginx/controller-v0.40.2/deploy/static/provider/cloud/deploy.yaml
        

        We can see the number of resources that’s going to create its own namespace, and to confirm they’re all up and running: –

        kubectl get all -n ingress-nginx
        

        Note the external IP of “localhost” for the ingress-nginx-controller service.

        Ok, now we can create an ingress to direct traffic to our applications. Here’s an example ingress.yaml file: –

        apiVersion: networking.k8s.io/v1
        kind: Ingress
        metadata:
          name: ingress-testwebsite
          annotations:
            kubernetes.io/ingress.class: "nginx"
        spec:
          rules:
          - host: www.testwebaddress.com
            http:
              paths:
               - path: /pageone
                 pathType: Prefix
                 backend:
                   service:
                     name: nginx-page1
                     port:
                       number: 8000
               - path: /pagetwo
                 pathType: Prefix
                 backend:
                   service:
                     name: nginx-page2
                     port:
                       number: 9000
        

        Watch out here. In Kubernetes v1.19 ingress went GA so the apiVersion changed. The yaml above won’t work in any version prior to v1.19.

        Anyway, the main points in this yaml are: –

          annotations:
            kubernetes.io/ingress.class: "nginx"
        

        Which makes this ingress resource use our ingress nginx controller.

          rules:
          - host: www.testwebaddress.com
        

        Which sets the URL we’ll be using to access our applications to http://www.testwebaddress.com

               - path: /pageone
                 pathType: Prefix
                 backend:
                   service:
                     name: nginx-page1
                     port:
                       number: 8000
               - path: /pagetwo
                 pathType: Prefix
                 backend:
                   service:
                     name: nginx-page2
                     port:
                       number: 9000
        

        Which routes our requests to the backend cluster IP services depending on the path (e.g. – http://www.testwebaddress.com/pageone will be directed to the nginx-page1 service)

        You can create the ingress.yaml file manually and then deploy to Kubernetes or just run: –

        kubectl apply -f https://gist.githubusercontent.com/dbafromthecold/a6805ca732eac278e902bbcf208aef8a/raw/e7e64375c3b1b4d01744c7d8d28c13128c09689e/testnginxingress.yaml
        

        Confirm that the ingress is up and running (it’ll take a minute to get an address): –

        kubectl get ingress


        N.B. – Ignore the warning (if you get one like in the screen shot above), we’re using the correct API version

        Finally, we now also need to add an entry for the web address into our hosts file (simulating a DNS entry): –

        127.0.0.1 www.testwebaddress.com
        

        And now we can browse to the web pages to see the ingress in action!

        And that’s the differences between using load balanced services or an ingress to connect to applications running in a Kubernetes cluster. The ingress allows us to only use the one external IP address and then route traffic to different backend services whereas with the load balanced services, we would need to use different IP addresses (and ports if configured that way) for each application.

        Thanks for reading!

        Decoding Helm Secrets

        Helm is a great tool for deploying applications to Kubernetes. We can bundle up all our yaml files for deployments, services etc. and deploy them to a cluster with one easy command.

        But another really cool feature of Helm, the ability to easily upgrade and roll back a release (the term for an instance of a Helm chart running in a cluster).

        Now, you can do this with kubectl. If I upgrade a deployment with kubectl apply I can then use kubectl rollout undo to roll back that upgrade. That’s great! And it’s one of the best features of Kubernetes.

        What happens when you upgrade a deployment is that a new replicaset is created for that deployment, which is running the upgraded application in a new set of pods.

        If we rollback with kubectl rollout undo the pods in the newest replicaset are deleted, and pods in an older replicaset are spun back up, rolling back the upgrade.

        But there’s a potential problem here. What happens if that old replicaset is deleted?

        If that happens, we wouldn’t be able to rollback the upgrade. Well we wouldn’t be able to roll it back with kubectl rollout undo, but what happens if we’re using Helm?

        Let’s run through a demo and have a look.

        So I’m on Windows 10, running in WSL 2, my distribution is Ubuntu: –

        ubuntu
        

        N.B. – The below code will work in a powershell session on Windows, apart from a couple of commands where I’m using Linux specific command line tools, hence why I’m in my WSL 2 distribution. (No worries if you’re on a Mac or native Linux distro)

        Anyway I’m going to navigate to Helm directory on my local machine, where I am going to create a test chart: –

        cd /mnt/c/Helm
        

        Create a chart called testchart: –

        helm create testchart
        

        Remove all unnecessary files in the templates directory: –

        rm -rf ./testchart/templates/*
        

        Create a deployment yaml file: –

        kubectl create deployment nginx \
        --image=nginx:1.17 \
        --dry-run=client \
        --output=yaml > ./testchart/templates/deployment.yaml
        

        Which will create the following yaml and save it as deployment.yaml in the templates directory: –

        apiVersion: apps/v1
        kind: Deployment
        metadata:
          creationTimestamp: null
          labels:
            app: nginx
          name: nginx
        spec:
          replicas: 1
          selector:
            matchLabels:
              app: nginx
          strategy: {}
          template:
            metadata:
              creationTimestamp: null
              labels:
                app: nginx
            spec:
              containers:
              - image: nginx:1.17
                name: nginx
                resources: {}
        status: {}
        

        Now create the deployment so we can run the expose command below: –

        kubectl create deployment nginx --image=nginx:1.17 
        

        Generate the yaml for the service with the kubectl expose command: –

        kubectl expose deployment nginx \
        --type=LoadBalancer \
        --port=80 \
        --dry-run=client \
        --output=yaml > ./testchart/templates/service.yaml
        

        Which will give us the following yaml and save it as service.yaml in the templates directory: –

        apiVersion: v1
        kind: Service
        metadata:
          creationTimestamp: null
          labels:
            app: nginx
          name: nginx
        spec:
          ports:
          - port: 80
            protocol: TCP
            targetPort: 80
          selector:
            app: nginx
          type: LoadBalancer
        status:
          loadBalancer: {}
        

        Delete the deployment, it’s not needed: –

        kubectl delete deployment nginx
        

        Recreate the values.yaml file with a value for the container image: –

        rm ./testchart/values.yaml
        echo "containerImage: nginx:1.17" > ./testchart/values.yaml
        

        Then replace the hard coded container image in the deployment.yaml with a template directive: –

        sed -i 's/nginx:1.17/{{ .Values.containerImage }}/g' ./testchart/templates/deployment.yaml
        

        So the deployment.yaml file now looks like this: –

        apiVersion: apps/v1
        kind: Deployment
        metadata:
          creationTimestamp: null
          labels:
            app: nginx
          name: nginx
        spec:
          replicas: 1
          selector:
            matchLabels:
              app: nginx
          strategy: {}
          template:
            metadata:
              creationTimestamp: null
              labels:
                app: nginx
            spec:
              containers:
              - image: {{ .Values.containerImage }}
                name: nginx
                resources: {}
        status: {}
        

        Which means that the container image is not hard coded. It’ll take the value of nginx:1.17 from the values.yaml file or we can override it with the set flag (which we’ll do in a minute).

        But first, deploy the chart to my local Kubernetes cluster running in Docker Desktop: –

        helm install testchart ./testchart
        

        Confirm release: –

        helm list


        N.B. – That app version is the default version set in the Chart.yaml file (which I haven’t updated)

        Check image running in deployment: –

        kubectl get deployment -o jsonpath='{ .items[*].spec.template.spec.containers[*].image }{"\n"}'
        

        Great. That’s deployed and the container image is the one set in the values.yaml file in the Chart.

        Now upgrade the release, replacing the default container image value with the set flag: –

        helm upgrade testchart ./testchart --set containerImage=nginx:1.18
        

        Confirm release has been upgraded (check the revision number): –

        helm list
        

        Also, confirm with the release history: –

        helm history testchart
        

        So we can see the initial deployment of the release and then the upgrade. App version remains the same as I haven’t changed the value in the Chart.yaml file. However, the image has been changed and we can see that with: –

        kubectl get deployment -o jsonpath='{ .items[*].spec.template.spec.containers[*].image }{"\n"}'
        

        So we’ve upgraded the image that’s running for the one pod in the deployment.

        Let’s have a look at the replicasets of the deployment: –

        kubectl get replicasets
        

        So we have two replicasets for the deployment created by our Helm release. The inital one running nginx v1.17 and the newest one running nginx v1.18.

        If we wanted to rollback the upgrade with kubectl, this would work (don’t run this code!): –

        kubectl rollout undo deployment nginx
        

        What would happen here is the that the pod under the newset replicaset would be deleted and a pod under the old replicaset would be spun up, rolling back nginx to v1.17.

        But we’re not going to do that, as we’re using Helm.

        Let’s grab the oldest replicaset name: –

        REPLICA_SET=$(kubectl get replicasets -o jsonpath='{.items[0].metadata.name }' --sort-by=.metadata.creationTimestamp)
        

        And delete it: –

        kubectl delete replicasets $REPLICA_SET
        

        So we now only have the one replicaset: –

        kubectl get replicasets
        

        Now try to rollback using the kubectl rollout undo command: –

        kubectl rollout undo deployment nginx
        

        The reason that failed is that we deleted the old replicaset, so there’s no history for that deployment, which we can see with: –

        kubectl rollout history deployment nginx
        

        But Helm has the history: –

        helm history testchart
        

        So we can rollback: –

        helm rollback testchart 1
        

        View release status: –

        helm list
        

        View release history: –

        helm history testchart
        

        View replicasets: –

        kubectl get replicasets
        

        The old replicaset is back! How? Let’s have a look at secrets within the cluster: –

        kubectl get secrets
        

        Ahhh, bet you anything the Helm release history is stored in those secrets! The initial release (v1), the upgrade (v2), and the rollback (v3).

        Let’s have a closer look at the first one: –

        kubectl get secret sh.helm.release.v1.testchart.v1 -o json
        

        Hmm, that release field looks interesting. What we could do is base64 decode it and then run it through decompression on http://www.txtwizard.net/compression which would give us: –

        {
        "name":"testchart",
        "info":
        	{
        		"first_deployed":"2020-08-09T11:21:20.4665817+01:00",
        		"last_deployed":"2020-08-09T11:21:20.4665817+01:00",
        		"deleted":"",
        		"description":"Install complete",
        		"status":"superseded"},
        		"chart":{"metadata":
        	{
        		"name":"testchart",
        		"version":"0.1.0",
        		"description":"A Helm chart for Kubernetes",
        		"apiVersion":"v2",
        		"appVersion":"1.16.0",
        		"type":"application"},
        		"lock":null,
        		"templates":[
        			{
        				"name":
        				"templates/deployment.yaml",
        				"data":"YXBpVmVyc2lvbjogYXBwcy92MQpraW5kOiBEZXBsb3ltZW50Cm1ldGFkYXRhOgogIGNyZWF0aW9uVGltZXN0YW1wOiBudWxsCiAgbGFiZWxzOgogICAgYXBwOiBuZ2lueAogIG5hbWU6IG5naW54CnNwZWM6CiAgcmVwbGljYXM6IDEKICBzZWxlY3RvcjoKICAgIG1hdGNoTGFiZWxzOgogICAgICBhcHA6IG5naW54CiAgc3RyYXRlZ3k6IHt9CiAgdGVtcGxhdGU6CiAgICBtZXRhZGF0YToKICAgICAgY3JlYXRpb25UaW1lc3RhbXA6IG51bGwKICAgICAgbGFiZWxzOgogICAgICAgIGFwcDogbmdpbngKICAgIHNwZWM6CiAgICAgIGNvbnRhaW5lcnM6CiAgICAgIC0gaW1hZ2U6IHt7IC5WYWx1ZXMuY29udGFpbmVySW1hZ2UgfX0KICAgICAgICBuYW1lOiBuZ2lueAogICAgICAgIHJlc291cmNlczoge30Kc3RhdHVzOiB7fQo="},{"name":"templates/service.yaml","data":"YXBpVmVyc2lvbjogdjEKa2luZDogU2VydmljZQptZXRhZGF0YToKICBjcmVhdGlvblRpbWVzdGFtcDogbnVsbAogIGxhYmVsczoKICAgIGFwcDogbmdpbngKICBuYW1lOiBuZ2lueApzcGVjOgogIHBvcnRzOgogIC0gcG9ydDogODAKICAgIHByb3RvY29sOiBUQ1AKICAgIHRhcmdldFBvcnQ6IDgwCiAgc2VsZWN0b3I6CiAgICBhcHA6IG5naW54CiAgdHlwZTogTG9hZEJhbGFuY2VyCnN0YXR1czoKICBsb2FkQmFsYW5jZXI6IHt9Cg=="}],"values":{"containerImage":"nginx:1.17"},"schema":null,"files":[{"name":".helmignore","data":"IyBQYXR0ZXJucyB0byBpZ25vcmUgd2hlbiBidWlsZGluZyBwYWNrYWdlcy4KIyBUaGlzIHN1cHBvcnRzIHNoZWxsIGdsb2IgbWF0Y2hpbmcsIHJlbGF0aXZlIHBhdGggbWF0Y2hpbmcsIGFuZAojIG5lZ2F0aW9uIChwcmVmaXhlZCB3aXRoICEpLiBPbmx5IG9uZSBwYXR0ZXJuIHBlciBsaW5lLgouRFNfU3RvcmUKIyBDb21tb24gVkNTIGRpcnMKLmdpdC8KLmdpdGlnbm9yZQouYnpyLwouYnpyaWdub3JlCi5oZy8KLmhnaWdub3JlCi5zdm4vCiMgQ29tbW9uIGJhY2t1cCBmaWxlcwoqLnN3cAoqLmJhawoqLnRtcAoqLm9yaWcKKn4KIyBWYXJpb3VzIElERXMKLnByb2plY3QKLmlkZWEvCioudG1wcm9qCi52c2NvZGUvCg=="}]},
        				"manifest":"---\n# 
        					Source: testchart/templates/service.yaml\n
        					apiVersion: v1\n
        					kind: Service\nmetadata:\n  
        					creationTimestamp: null\n  
        					labels:\n    
        					app: nginx\n  
        					name: nginx\n
        					spec:\n  
        					ports:\n  
        					- port: 80\n    
        					protocol: TCP\n    
        					targetPort: 80\n  
        					selector:\n    
        					app: nginx\n  
        					type: LoadBalancer\n
        					status:\n  loadBalancer: {}\n---\n# 
        					
        					Source: testchart/templates/deployment.yaml\n
        					apiVersion: apps/v1\n
        					kind: Deployment\n
        					metadata:\n  
        					creationTimestamp: null\n  
        					labels:\n    
        					app: nginx\n  
        					name: nginx\nspec:\n  
        					replicas: 1\n  
        					selector:\n    
        					matchLabels:\n      
        					app: nginx\n  
        					strategy: {}\n  
        					template:\n    
        					metadata:\n      
        					creationTimestamp: null\n      
        					labels:\n        
        					app: nginx\n    
        					spec:\n      
        					containers:\n      
        					- image: nginx:1.17\n        
        					name: nginx\n        
        					resources: {}\n
        					status: {}\n",
        					"version":1,
        					"namespace":"default"
        			}
        

        BOOM! That look like our deployment and service manifests! We can see all the information contained in our initial Helm release (confirmed as the container image is nginx:1.17)!

        So by storing this information as secrets in the target Kubernetes cluster, Helm can rollback an upgrade even if the old replicaset has been deleted! Pretty cool!

        Not very clean though, eh? And have a look at that data field…that looks suspiciously like more encrypted information (well, because it is 🙂 ).

        Let’s decrypt it! This time on the command line: –

        kubectl get secret sh.helm.release.v1.testchart.v1 -o jsonpath="{ .data.release }" | base64 -d | base64 -d | gunzip -c | jq '.chart.templates[].data' | tr -d '"' | base64 -d
        

        Ha! There’s the deployment and service yaml files!

        By using Helm we can rollback a release even if the old replicaset of the deployment has been deleted as Helm stores the history of a release in secrets in the target Kubernetes cluster. And by using the code above, we can decrypt those secrets and have a look at the information they contain.

        Thanks for reading!