A while back I posted about a couple of side projects that I’ve been working on when I get the chance. One of those was the Burrito Bot…a bot to make burrito recommendations in Ireland 🙂
Over the last 18 months or so I’ve reworked this project to utilise the new vector search functionality in SQL Server 2025…so now it looks like this: –
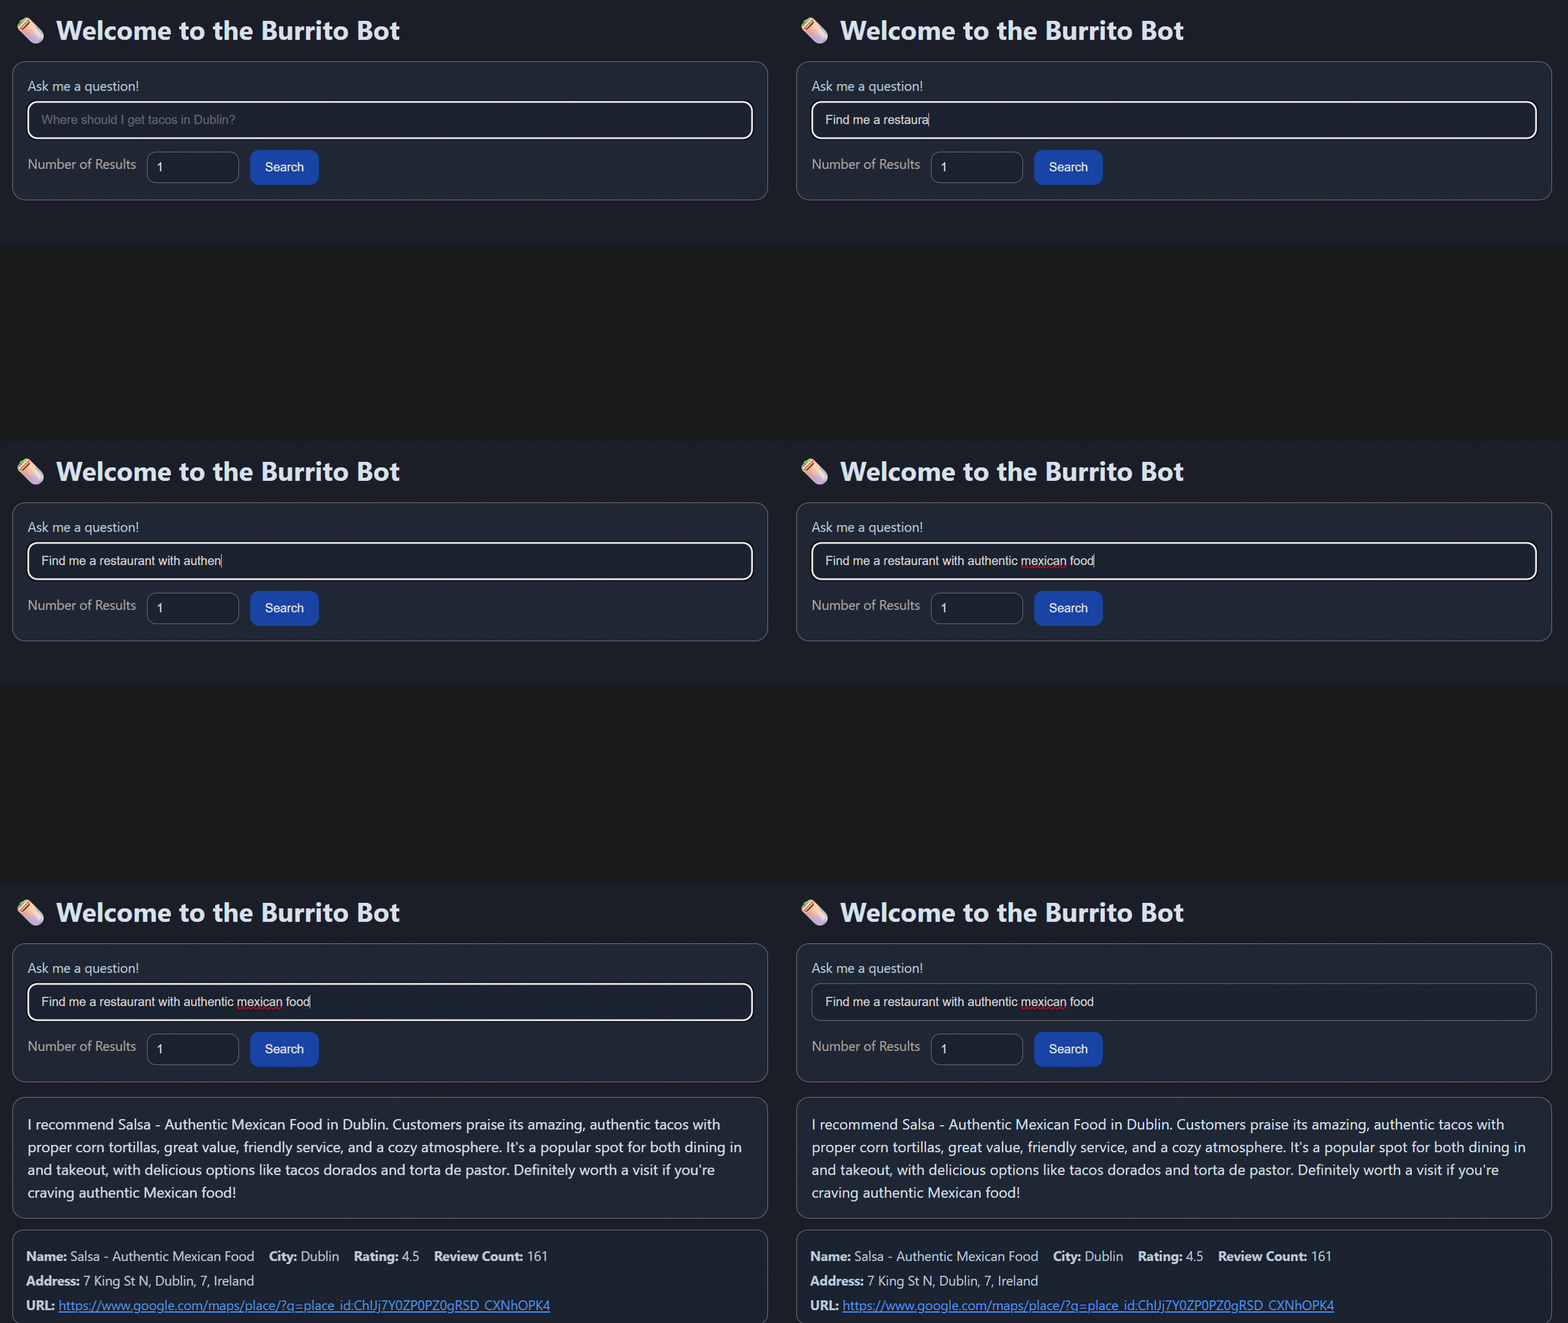
Pretty cool, eh?
So this is really a way for me to learn the new features in SQL Server 2025…but there’s a whole bunch of aspects to this, from data collection to creating the web app, so what I’m going to do is break this down into sections here and then post follow up blogs which will be a deep dive into each of those sections.
But here we will go through the whole process, so let’s build a bot that’ll provide burrito recommendations in Ireland using semantic similarity searching in SQL Server 2025…all the code detailed here is available in a Github repository: –
https://github.com/dbafromthecold/burrito-bot
Semantic Similarity Search
When I built the first iteration of this bot, I pulled a load of information down from Yelp! that had things like:
Name
Address
Rating
Number of Reviews
However…I realised that I was being a bit daft! SQL has been able to perform searches over this type of data for YEARS! So why bother with the new features in SQL 2025?
Ok, but how about the statement in the gif above? Or something like this?
Find me a restaurant with a cozy atmosphere
What if we could capture the meaning behind that statement and search say, restaurant reviews to see if any of that data has a similar meaning?
That’s exactly what the new features in SQL Server 2025 allow us to do, perform something called semantic similarity searching over our data. Semantic similarity searching is defined as…
Semantic similarity search finds results with similar meaning, even when the exact words differ, by comparing vector embeddings generated from data
So that’s what I ended up doing…using restaurant review data for the Burrito Bot!
Infrastructure
Ok so what do we need to do this? Well, an instance of SQL Server 2025 (obviously)…but we also need an embedding model…to send our data to generate our embeddings.
I could have built all this locally, and if you want to do that my colleagues Anthony Nocentino and Andy Yun have blogs on how to do just that. But I decided to go and build everything in Azure…as that gives me access to the Azure Foundry which has a number of models that I can use.
So, we need an instance of SQL 2025…which I installed on a VM…didn’t go with Managed Instance or SQL Database, and I deployed a model called text-embedding-3-small to send my data to.
Gathering the data
As I mentioned earlier, I started off with Yelp! data. Initially just had restaurant metadata but then decided to include that in my database but actually perform searches over review data. Unfortunately by the time I’d decided this, my free trial had run out with Yelp…so I went looking elsewhere.
Now there’s a bunch of free APIs that I can hit to pull the required data but let’s be honest here…most people use Google Maps to search for restaurants (well anything) so I went there.
To do this, I created an account in Google Cloud and enabled the Places API.
This gave me an endpoint that I can hit to pull data down about specific restaurant types in specific locations. From the code below, you’ll see that I went with 6 cities around Ireland…used their Latitude and Longitude, and searched a 20km radius.
Oh I did this one city at a time, so I can troubleshoot but also so that I’m not firing off a tonne of APIs calls at once. I’m being overly paranoid here but this isn’t free and my personal credit card is tied into my Google account and I’ve heard enough stories about people getting massive bills, so yeah being really cautious.
I also recommend that if you do this yourself, you place tight quotas on the API that you’re calling 🙂
So here’s the code…
$ApiKey = "XXXXXXXXXXXXXXXXXXXXXXXXXXXXXXXXXXXXXXX"
$Keyword = "mexican"
$BaseUrl = "https://maps.googleapis.com/maps/api/place/nearbysearch/json"
$Radius = 20000
$Cities = @(
@{ Name="Dublin"; Lat=53.3498; Lng=-6.2603 },
@{ Name="Cork"; Lat=51.8985; Lng=-8.4756 },
@{ Name="Limerick"; Lat=52.6638; Lng=-8.6267 },
@{ Name="Galway"; Lat=53.2707; Lng=-9.0568 },
@{ Name="Belfast"; Lat=54.5973; Lng=-5.9301 },
@{ Name="Waterford"; Lat=52.2593; Lng=-7.1101 }
)
$CityName = "Dublin"
$City = $Cities | Where-Object { $_.Name -eq $CityName }
$Latitude = $City.Lat
$Longitude = $City.Lng
$Results = @()
$NextPageToken = $null
$Page = 1
do {
if ($NextPageToken) {
Start-Sleep -Seconds 2
$Url = "$BaseUrl" + "?pagetoken=$NextPageToken&key=$ApiKey"
}
else {
$Url = "$BaseUrl" + "?location=$Latitude,$Longitude" +
"&radius=$Radius" +
"&type=restaurant" +
"&keyword=$Keyword" +
"&key=$ApiKey"
}
Write-Host "Calling page $Page"
$Response = Invoke-RestMethod -Method GET -Uri $Url
if ($Response.status -ne "OK") {
Write-Error "Google API returned status: $($Response.status)"
break
}
$Results += $Response.results
$NextPageToken = $Response.next_page_token
$Page++
} while ($NextPageToken)
$AllResults = @()
foreach ($Place in $Results) {
$AllResults += [PSCustomObject]@{
place_id = $Place.place_id
name = $Place.name
rating = $Place.rating
review_count = $Place.user_ratings_total
price_level = $Place.price_level
address = $Place.vicinity
phone_number = $Place.international_phone_number
latitude = $Place.geometry.location.lat
longitude = $Place.geometry.location.lng
business_status = $Place.business_status
}
}
$AllResults | Export-Csv -Path "C:\temp\mexican_restaurants_$CityName.csv" -NoTypeInformation -Encoding UTF8
What’s happening here is that google will only provide 20 results per page so we’re batching through the retrieved data, 20 at a time…then writing down to a CSV file.
But this API only gives us metadata, things like number of ratings and reviews. Which is fine if we were doing searches like: –
Find me a restaurant with a 5 star rating and over 1000 reviews
But that’s not what we’re after here. So let’s use another API, the Places (New) API, which’ll allow us to grab review data: –
$CityName = "Dublin"
$ApiKey = "XXXXXXXXXXXXXXXXXXXXXXXXXXXXXXXXXXXXXXXXX"
$restaurants = Import-Csv "C:\temp\restaurants\mexican_restaurants_placeids_$CityName.csv"
$PlaceIDs= $restaurants.place_id
$Results = @()
foreach($PlaceId in $PlaceIDs){
$DetailsUrl = "https://places.googleapis.com/v1/places/$PlaceId"
$Headers = @{
"X-Goog-Api-Key" = $ApiKey
"X-Goog-FieldMask" = "id,displayName,rating,userRatingCount,formattedAddress,location,reviews"
}
$Response = Invoke-RestMethod -Method GET -Uri $DetailsUrl -Headers $Headers
$Results += $Response
}
$ReviewRows = foreach ($p in $Results) {
if (-not $p.reviews) { continue }
foreach ($r in $p.reviews) {
[PSCustomObject]@{
place_id = $p.id
place_name = $p.displayName.text
formatted_address = $p.formattedAddress
latitude = $p.location.latitude
longitude = $p.location.longitude
place_rating = $p.rating
place_review_count = $p.userRatingCount
review_name = $r.name
review_rating = $r.rating
review_published_utc= $r.publishTime
review_relative_time= $r.relativePublishTimeDescription
review_text = $r.text.text
review_original_text= $r.originalText.text
review_maps_uri = $r.googleMapsUri
}
}
}
$ReviewRows | Export-Csv "C:\temp\restaurants\mexican_restaurant_reviews_$CityName.csv" -NoTypeInformation -Encoding UTF8
This pulls the place_id from the CSV generated from the data via the previous API call and gets the review data for that restaurant. This’ll give a maximum of 5 reviews per restaurant, which is fine for our search.
Now we have the raw data…let’s go ahead and build the database.
Database Design
Here’s the statement to create the database: –
CREATE DATABASE [burrito-bot-db]
ON PRIMARY
( NAME = N'burrito-bot-db', FILENAME = N'F:\SQLData1\burrito-bot-db.mdf', SIZE = 1048576KB , MAXSIZE = UNLIMITED, FILEGROWTH = 524288KB ),
FILEGROUP [ARCHIVE]
( NAME = N'burrito-bot-db-archive', FILENAME = N'F:\SQLData1\burrito-bot-db-archive.ndf', SIZE = 1048576KB , MAXSIZE = UNLIMITED, FILEGROWTH = 524288KB ),
FILEGROUP [DATA]
( NAME = N'burrito-bot-db-data', FILENAME = N'F:\SQLData1\burrito-bot-db-data.ndf', SIZE = 1048576KB , MAXSIZE = UNLIMITED, FILEGROWTH = 524288KB ),
FILEGROUP [EMBEDDINGS]
( NAME = N'burrito-bot-db-embeddings', FILENAME = N'F:\SQLData1\burrito-bot-db-embeddings.ndf', SIZE = 1048576KB , MAXSIZE = UNLIMITED, FILEGROWTH = 524288KB ),
FILEGROUP [RAW_DATA]
( NAME = N'burrito-bot-db-raw-data', FILENAME = N'F:\SQLData1\burrito-bot-db-raw-data.ndf', SIZE = 1048576KB , MAXSIZE = UNLIMITED, FILEGROWTH = 524288KB )
LOG ON
( NAME = N'burrito-bot-db_log', FILENAME = N'G:\SQLTLog1\burrito-bot-db_log.ldf', SIZE = 131072KB , MAXSIZE = UNLIMITED, FILEGROWTH = 524288KB );
GO
Not doing anything too mad here, have a data filegroup to hold my tables, a raw_data filegroup to host the data that will be imported from the CSVs, and an embeddings filegroup as I want to keep the embeddings separate from my main data (there’s a reason for this that I will talk about later on). And I always throw in an archive filegroup so I can chuck stuff in there that I think I may no longer need but may want to come back to.
Now let’s create some tables to hold the data. I’m splitting out the restaurant metadata, reviews, and embeddings: –
CREATE TABLE [data].[restaurants](
[id] [INT] IDENTITY(1,1) CONSTRAINT [pk_restaurants] PRIMARY KEY CLUSTERED NOT NULL,
[place_id] [NVARCHAR](255) NOT NULL,
[name] [NVARCHAR](50) NOT NULL,
[city] [NVARCHAR](50) NOT NULL,
[rating] [FLOAT] NOT NULL,
[review_count] [SMALLINT] NOT NULL,
[address] [NVARCHAR](100) NOT NULL,
[phone] [NVARCHAR](50) NULL,
[url] [NVARCHAR](200) NOT NULL,
) ON [DATA];
GO
CREATE TABLE [data].[reviews](
review_id [INT] IDENTITY(1,1) CONSTRAINT [pk_reviews] PRIMARY KEY CLUSTERED NOT NULL,
restaurant_id [INT] NOT NULL,
place_id [NVARCHAR](50) NOT NULL,
review_name [NVARCHAR](150) NOT NULL,
review_rating [TINYINT] NOT NULL,
review_published_utc [NVARCHAR](50) NOT NULL,
review_text [NVARCHAR](MAX) NOT NULL COLLATE Latin1_General_100_CI_AS_SC_UTF8
) ON [DATA];
GO
CREATE TABLE [embeddings].[restaurant_review_embeddings](
[id] [INT] IDENTITY(1,1) CONSTRAINT [pk_embeddings] PRIMARY KEY CLUSTERED NOT NULL,
[restaurant_id] [INT] NOT NULL,
[embeddings] [VECTOR](1536, FLOAT32) NULL,
) ON [EMBEDDINGS];
GO
Couple of things to note here is the VECTOR data type for the [embeddings] column in the [embeddings].[restaurant_review_embeddings] table and the collation of the review_text column.
I went with FLOAT32, which is the default base type, which supports up to 1998 dimensions. The number of dimensions is determined by the model that we are generating the embeddings from and the text-embedding-3-small model that is being used here returns embeddings with 1536 dimensions. Now this can be overridden but let’s keep things simple.
SQL also supports the FLOAT16 type for vector columns…so if storage is a concern or if the model that you are using returns more than 1998 dimensions…that is an option. But here, keeping things simple, we’ll stay with the default.
For the collation…I used Latin1_General_100_CI_AS_SC_UTF8 because the review data has emojis in it and that collation supports them 🙂
OK, so we also need tables to import the raw data from the CSVs to. I went with one table per city, could have just been one table, but wanted to separate them out. Here’s the structure of one: –
CREATE TABLE [raw_data].[mexican_restaurant_reviews_Belfast](
[place_id] [nvarchar](50) NOT NULL,
[place_name] [nvarchar](50) NOT NULL,
[formatted_address] [nvarchar](100) NOT NULL,
[latitude] [float] NOT NULL,
[longitude] [float] NOT NULL,
[place_rating] [float] NOT NULL,
[place_review_count] [smallint] NOT NULL,
[review_name] [nvarchar](150) NOT NULL,
[review_rating] [tinyint] NOT NULL,
[review_published_utc] [nvarchar](50) NOT NULL,
[review_relative_time] [nvarchar](50) NOT NULL,
[review_text] [nvarchar](max) COLLATE Latin1_General_100_CI_AS_SC_UTF8 NOT NULL,
[review_original_text] [nvarchar](max) COLLATE Latin1_General_100_CI_AS_SC_UTF8 NOT NULL,
[review_maps_uri] [nvarchar](200) NOT NULL
) ON [RAW_DATA]
GO
Again, with the changed collation to support the emojis.
Importing the data
First thing to do is to import the CSV files into each of the raw data tables: –
BULK INSERT [raw_data].[mexican_restaurant_reviews_Belfast]
FROM 'C:\git\burrito-bot\Data\Raw Data\reviews\mexican_restaurant_reviews_Belfast.csv'
WITH (
FORMAT = 'CSV',
FIRSTROW = 2,
CODEPAGE = '65001'
);
GO
CODEPAGE = ‘65001’ being used here as it’ll tell SQL to interpret the file as UTF-8 encoded text, allowing emojis.
Then once the data is in the raw tables, it can be reviewed, cleansed, and then imported into the main data tables: –
INSERT INTO [data].[restaurants]
([place_id],
[name]
,[city]
,[rating]
,[review_count]
,[address]
,[phone]
,[url])
SELECT DISTINCT
place_id
,place_name
,'Belfast'
,place_rating
,place_review_count
,formatted_address
,NULL
,'https://www.google.com/maps/place/?q=place_id:' + [place_id]
FROM [raw_data].[mexican_restaurant_reviews_Belfast];
GO
INSERT INTO [data].[reviews]
([restaurant_id]
,[place_id]
,[review_name]
,[review_rating]
,[review_published_UTC]
,[review_text])
SELECT
r.id
,d.place_id
,d.review_name
,d.review_rating
,d.review_published_UTC
,d.review_text
FROM [raw_data].[mexican_restaurant_reviews_Belfast] AS d
INNER JOIN [data].[restaurants] r ON d.place_id = r.place_id
WHERE r.City = 'Belfast'
GO
Not gonna lie here, I totally didn’t check the data and 100% just imported it into the main data tables…but it gives me the option to do so in the future (which I totally will do, honest, at some point).
The URL column in the restuarants table will allow for the user to click on it and be taken to the restaurant’s entry in google maps (handy, eh?).
Now that we have the data in the main table, we can go ahead and create our embeddings!
Creating an external model
We need to create a reference to the embedding model so that we can create our embeddings. To do this, we create a master key in the database, a credential to hold the API Key to authenticate to the model, and then use the CREATE EXTERNAL MODEL statement with the model details: –
CREATE MASTER KEY ENCRYPTION BY PASSWORD = 'Th1s1s@Str0ngP@assw0rd!';
GO
CREATE DATABASE SCOPED CREDENTIAL [https://burrito-bot-ai.openai.azure.com]
WITH IDENTITY = 'HTTPEndpointHeaders', SECRET = N'{"api-key":"XXXXXXXXXXXXXXXXXXXXXXXXXXXXXXXXXXXXXXXXXXXXXXXXXXXXXXXXXXXXX"}'
GO
CREATE EXTERNAL MODEL [text-embedding-3-small]
WITH (
LOCATION = 'https://burrito-bot-ai.openai.azure.com/openai/deployments/text-embedding-3-small/embeddings?api-version=2023-05-15',
API_FORMAT = 'Azure OpenAI',
MODEL_TYPE = EMBEDDINGS,
MODEL = 'text-embedding-3-small',
CREDENTIAL = [https://burrito-bot-ai.openai.azure.com]
);
GO
I pulled the info for the model out of Azure Foundry…but now we have the reference to the model…we can go and create the embeddings!
Generating embeddings
What we’re doing here is using a new function, AI_GENERATE_EMBEDDINGS, to send our data over to the model which will return embeddings representing the meaning of that data: –
INSERT INTO [embeddings].[restaurant_review_embeddings] (restaurant_id, embeddings)
SELECT
rv.restaurant_id,
AI_GENERATE_EMBEDDINGS(
CONCAT(
d.name, ' is a Mexican restaurant in ', d.city, '. ',
'Customer reviews say:', CHAR(13) + CHAR(10),
STRING_AGG(
' - ' + REPLACE(rv.review_text, CHAR(13) + CHAR(10), ' '),
CHAR(13) + CHAR(10)
) WITHIN GROUP (ORDER BY rv.review_published_utc)
)
USE MODEL [text-embedding-3-small]
)
FROM [data].[reviews] rv
INNER JOIN [data].[restaurants] d ON rv.restaurant_id = d.id
GROUP BY rv.restaurant_id, d.name, d.city;
Here we’re building up a single piece of text per restaurant by combining some basic context (name and city) with the review data. What I’m trying to do here is get the embeddings to represent the overall “feel” of a restaurant rather than individual reviews.
We could also include things like the overall rating or number of reviews, but for now we’ll keep it focused on the review text.
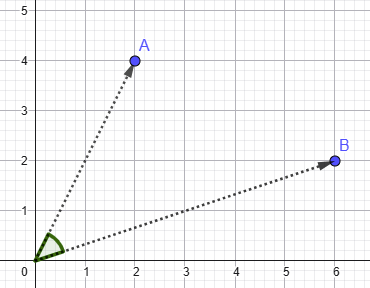
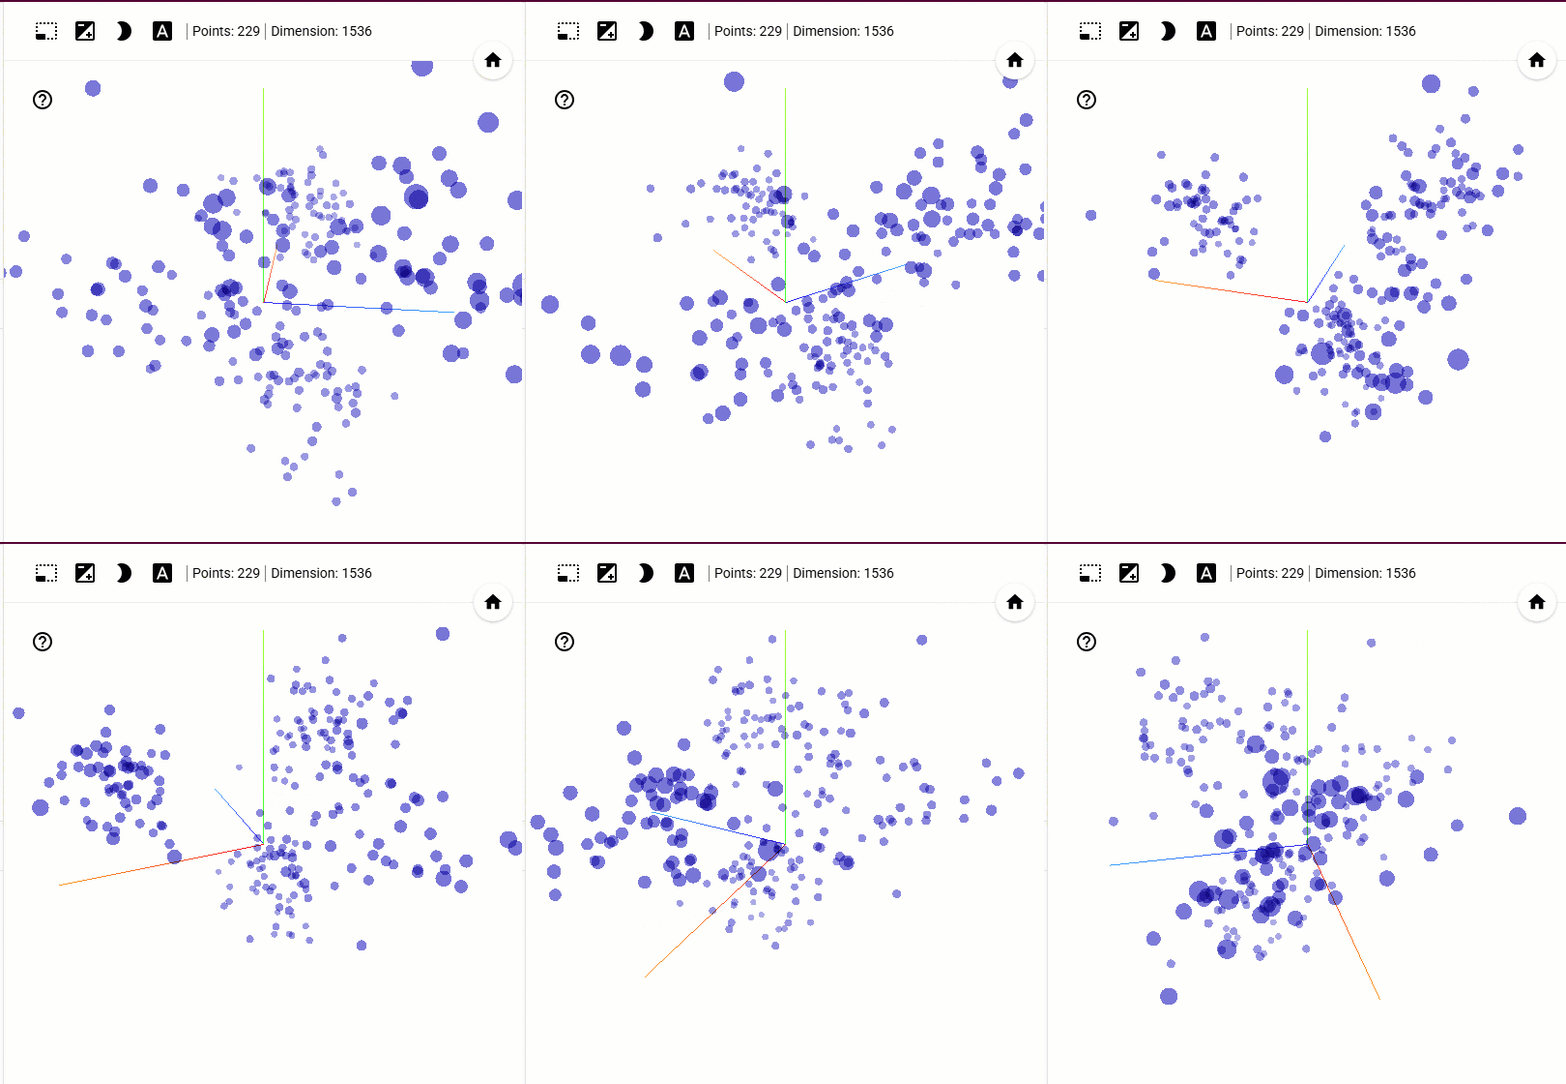
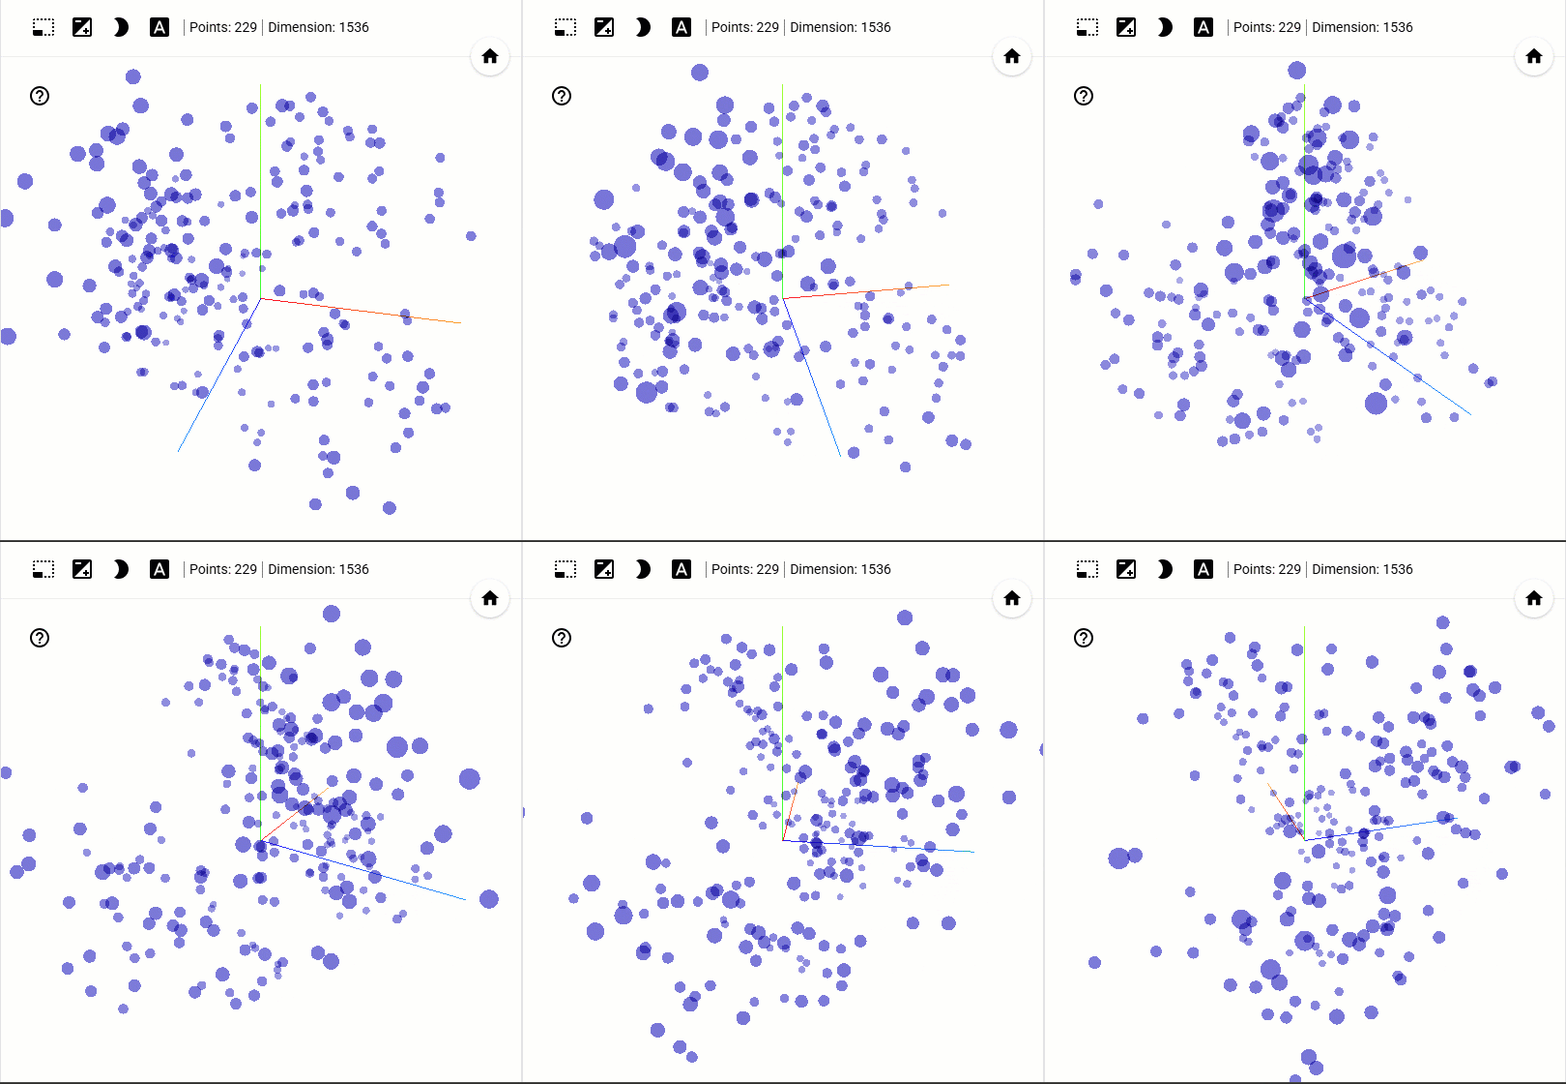
This will return one embedding per restaurant, with 1536 dimensions…each dimension corresponding to an axis in high dimensional space with embeddings that contain similar meaning grouped together. When we come to comparing embeddings in the sections below, we can use different metrics to work out how close embeddings are to each other in that high dimensional space and therefore determine how similar they are in meaning.
This is something that I want to 100% dive further in on (as well as a load of other stuff) as I find this incredibly interesting but let’s move on to actually searching our data.
UPDATE – APRIL 2026
I’ve written a new post diving into how we can visual vectors, check it out here: –
https://dbafromthecold.com/2026/04/17/visualising-vectors-in-high-dimensional-space/
Performing a search
Phew, still with me? We’ve done all the ground work so now we can start performing semantic similarity searches over our data.
The first search type that we’re going to do is called Exact Nearest Neighbour search…or k-NN search (k is the number of results returned). We do this with a new function called VECTOR_DISTANCE: –
DECLARE @search_text   NVARCHAR(MAX) = 'Find me a restaurant with a good atmosphere';
DECLARE @search_vector VECTOR(1536)  = AI_GENERATE_EMBEDDINGS(@search_text USE MODEL [text-embedding-3-small]);

SELECT TOP(1)
	r.[id],
	r.[name],
	r.[city],
	r.[rating],
	r.[review_count],
	r.[address],
	r.[phone],
	r.[url],
	VECTOR_DISTANCE('cosine', @search_vector, e.embeddings) AS distance
FROM [data].[restaurants] r
INNER JOIN [embeddings].[restaurant_review_embeddings] e ON r.id = e.restaurant_id
ORDER BY distance;
GO
What’s happening here is that we take a search statement, generate an embedding from it using our model, and then compare it to the rest of the embeddings in the table.
VECTOR_DISTANCE then calculates a distance metric between our search vector and the other vectors in the table…which we then order by that distance metric
We have three different metrics available to us. Breaking them down (and this is very high level) we have: –
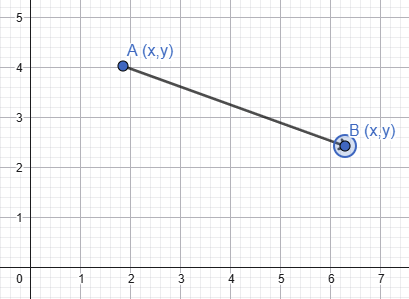
Euclidean – How far apart are these vectors in space?
Dot Product – How aligned are they, factoring in magnitude?
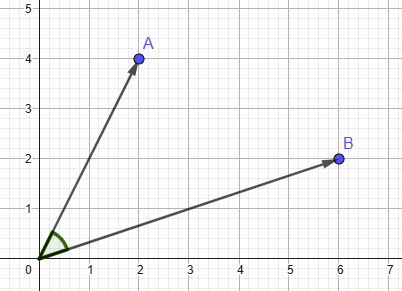
Cosine – How aligned are they, ignoring magnitude?
Generally the metric recommended is cosine as that removes the magnitude of the vector as a factor…so that we’re just focused on the meaning captured, which is exactly what we want for our bot. Now this is a REAL rabbit hole to go down, and I will get a deep dive into this as soon as possible…but for now, we’ll go with cosine.
UPDATE – MAY 2026
I’ve written a new post diving into each distance metric, check it out here: –
https://dbafromthecold.com/2026/05/28/distance-metrics-for-semantic-similarity-searches-in-sql-server-2025/
So that’s searching our data! Cool, eh? If you’re following along, check the reviews of the restaurants returned…why did those specific restaurants come back in the search? What phrases in the review would result in the review meaning being similar to the meaning of our search query?
However, there’s a downside here…VECTOR_DISTANCE performs a search over the entire table…every row…which means table scans!
And table scans are bad 🙂
Ok not so much here as we’re working with a small data set, but if we had a very large data set…we couldn’t be scanning all the data for every search.
There has to be another way.
Vector Indexes and approximate search
So we don’t want to be scanning all our data each time we search…in traditional SQL Server operations we prevent this by creating indexes, and it’s exactly the same here! We have a new type of index, the vector index, that we can create to help us speed up our searches.
As of the time of this post, vector indexes are still a preview feature…so let’s switch on preview features in the database: –
ALTER DATABASE SCOPED CONFIGURATION SET PREVIEW_FEATURES = ON
GO
And now create our index…and it does look like a normal index create statement: –
CREATE VECTOR INDEX vec_idx ON [embeddings].[restaurant_review_embeddings]([embeddings])
WITH (
    METRIC  = 'cosine', -- euclidean and dot also supported
    TYPE    = 'diskann',-- only diskann supported
    MAXDOP  = 8         -- set the parallelism of the create index operation - currently ignored!
);
GO
We’re creating an index, using a distance metric, specifying an algorithm called DiskANN to create the index with, and then setting a MAXDOP value with which to create the index.
Now this helps us out because it’s the basis for Approximate Nearest Neighbour search. The creation of the index means we use it during searches and avoid comparing our search query against every row in the table. So no more table scans! However what we gain in speed we lose a little in accuracy…not much, about 95-99% accuracy compared to k-NN search but hey, we’re not dealing with financial data here…95% accuracy is fine.
So now we can perform an ANN search using the VECTOR_SEARCH function: –
DECLARE @question       NVARCHAR(MAX) = 'Find me a restaurant with a good atmosphere';
DECLARE @search_vector  VECTOR(1536)  = AI_GENERATE_EMBEDDINGS(@question USE MODEL [text-embedding-3-small]);

SELECT
    r.[id]              AS [restaurant_id],
    r.[name]            AS [Name],
    r.[city]            AS [City],
    ROUND(r.[rating],1) AS [Rating],
    r.[review_count]    AS [Review Count],
    r.[address]         AS [Address],
    r.[phone]           AS [Phone Number],
    r.[url]             AS [URL],
    vs.distance
FROM VECTOR_SEARCH(
    TABLE      = [embeddings].[restaurant_review_embeddings] AS e,
    COLUMN     = [embeddings],
    SIMILAR_TO = @search_vector,
    METRIC     = 'cosine',
    TOP_N      = 5
) AS vs
INNER JOIN [data].[restaurants] r ON r.id = e.restaurant_id
ORDER BY vs.distance;
GO
Very similar to VECTOR_DISTANCE, using the index to work out the embeddings with the closest meaning and return the results. Again, if you’re following along…have a look at the restaurants returned…are they different than the results from the k-NN search? What is in the review data that would make them be returned in this search?
The Web Application
OK, we are pretty much done! All the functionality is there to perform semantic similarity searching over restaurant review data. All we need is a front end, which is a web application built in Azure with python. I’m not going to post the whole script here (this post is long enough and I want it to focus on the SQL Server functionality) but it’s available in the azure-web-app branch of the Burrito-Bot github repository.
All it is really doing is running a stored procedure in the database…so let’s create that stored procedure: –
CREATE OR ALTER PROCEDURE [dbo].[search_restaurants]
    @question     NVARCHAR(MAX),
    @num_results  INT = 5
AS
BEGIN
    SET NOCOUNT ON;

    DECLARE @search_vector VECTOR(1536) =
        AI_GENERATE_EMBEDDINGS(@question USE MODEL [text-embedding-3-small]);

    SELECT
        r.[name] AS [Name],
        r.[city] AS [City],
        ROUND(r.[rating],1) AS [Rating],
        r.[review_count] AS [Review Count],
        r.[address] AS [Address],
        r.[phone] AS [Phone Number],
        r.[url] AS [URL],
        --vs.distance,
        combined_reviews.reviews AS [combined_reviews]
    FROM VECTOR_SEARCH(
        TABLE      = [embeddings].[restaurant_review_embeddings] AS e,
        COLUMN     = [embeddings],
        SIMILAR_TO = @search_vector,
        METRIC     = 'cosine',
        TOP_N      = @num_results
    ) AS vs
    INNER JOIN [data].[restaurants] r ON r.id = e.restaurant_id
    INNER JOIN (SELECT
                    rv.restaurant_id as restaurant_id,
                    CONCAT(
                        d.name COLLATE Latin1_General_100_CI_AS_SC_UTF8,
                        N' is a Mexican restaurant in ',
                        d.city COLLATE Latin1_General_100_CI_AS_SC_UTF8,
                        N'. Customer reviews say:', CHAR(13) + CHAR(10),
                        STRING_AGG(
                            ' - ' + REPLACE(rv.review_text, CHAR(13) + CHAR(10), ' '),
                            CHAR(13) + CHAR(10)
                        ) WITHIN GROUP (ORDER BY rv.review_published_utc)
                    ) as reviews
                FROM [data].[reviews] rv
                INNER JOIN [data].[restaurants] d ON rv.restaurant_id = d.id
                GROUP BY rv.restaurant_id, d.name, d.city) as combined_reviews ON r.id = combined_reviews.restaurant_id
    ORDER BY vs.distance;
END
GO
This is using the VECTOR_SEARCH function but also retrieving the review data in the result set. Why? So that it can be passed to another model (gpt-4.1-mini in this case) in the Azure Foundry to generate a custom response (this is the Generation part of a RAG application).
But that’s it…we have a Burrito-Bot!
Summary
So that’s how to perform semantic similarity searching in SQL Server 2025 using the new VECTOR capabilities! We built the database from the ground up, collected the data, generated embeddings, and then performed searches over those embeddings.
This is a really interesting topic that I must admit, I’ve gone down a rabbit hole with…I’ll be posting deep dives to each of the sections over the next while…when I get a chance but I hope this has been a good overview.
Thanks for reading!